Cheap Insights
Logging API Gateway Calls Using AWS CloudWatch Logs Insights and PowerShell Lamba Functions
by JamesQMurphy | November 26, 2019
Did you know that you can write AWS Lambda Functions in PowerShell? Honestly, I didn't know it until a few weeks ago.
AWS announced Lambda support of PowerShell Core over a year ago, but I didn't learn about it until I was chatting with another attendee at Microsoft Ignite 20191. And apparently, I wasn't the only one who didn't know. He went on to tell me that his coworkers insisted that it wasn't possible. Naturally, he took great pleasure in showing them his PowerShell scripts already running as Lambda functions. This was big news for me, because I'm a terrible JavaScript programmer, and I don't know a lick of Python2. But I know PowerShell very well, and I was thrilled to learn that I could start writing rich Lambda functions in my favorite scripting language, without having to ramp up on JavaScript or Python first.
When you think about it, it makes sense. AWS Lambda supports .NET Core 2.1, which is what PowerShell 6.0 runs on. But AWS took it one step further. This is a fully-supported solution, complete with tooling that takes care of everything you need to package and deploy PowerShell scripts as Lambda functions. I won't get into the mechanics of how the AWS libraries do it; that's a topic for a future blog post. Instead, I'll focus on my first use of the technique -- AWS CloudWatch Logs Insights.
How AWS Does Logging
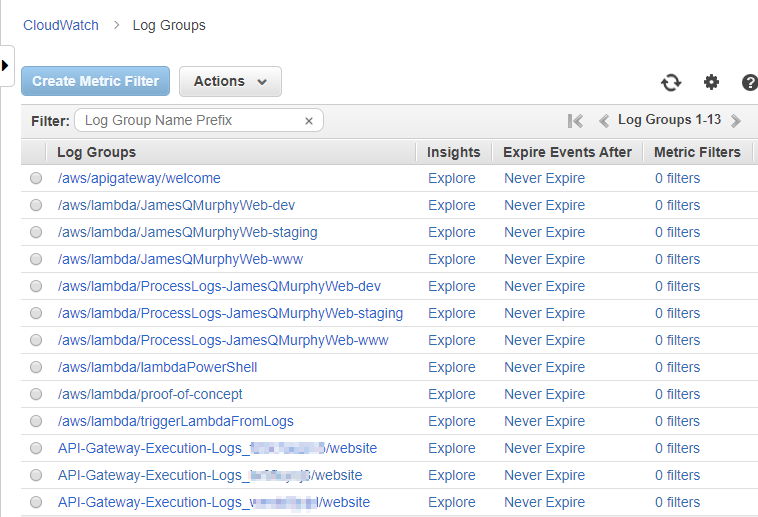
The built-in logging system in AWS is CloudWatch Logs, and to my knowledge, every AWS service uses it for logging. CloudWatch consists of Log Groups (similar to folders), which in turn contain Log Streams (akin to files). Each instance of a service within AWS writes log messages to Log Streams within its own Log Group. For example, in the screenshot below, you can see the Log Groups created by Lambda functions as well as the ones created by API Gateway:
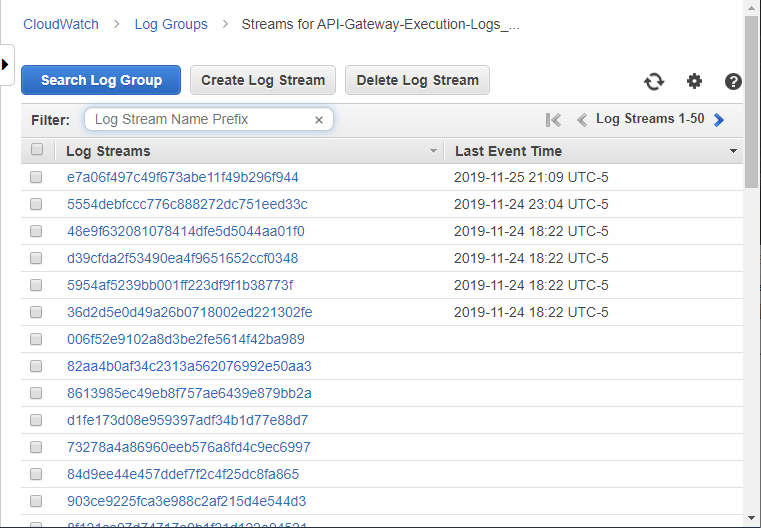
Clicking into a Log Group (in this case, one of the API Gateway Log Groups), you can see the various Log Streams. Note that API Gateway keeps several empty Log Streams available in case it needs to quickly write logs:
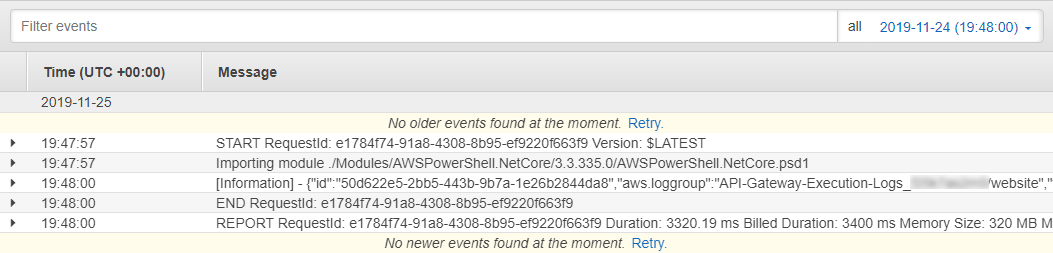
Here is a snippet of one of the CloudWatch Log Streams for API Gateway. Note that I needed to turn on logging inside of API Gateway; this is done at the deployment level in case you need to do it.
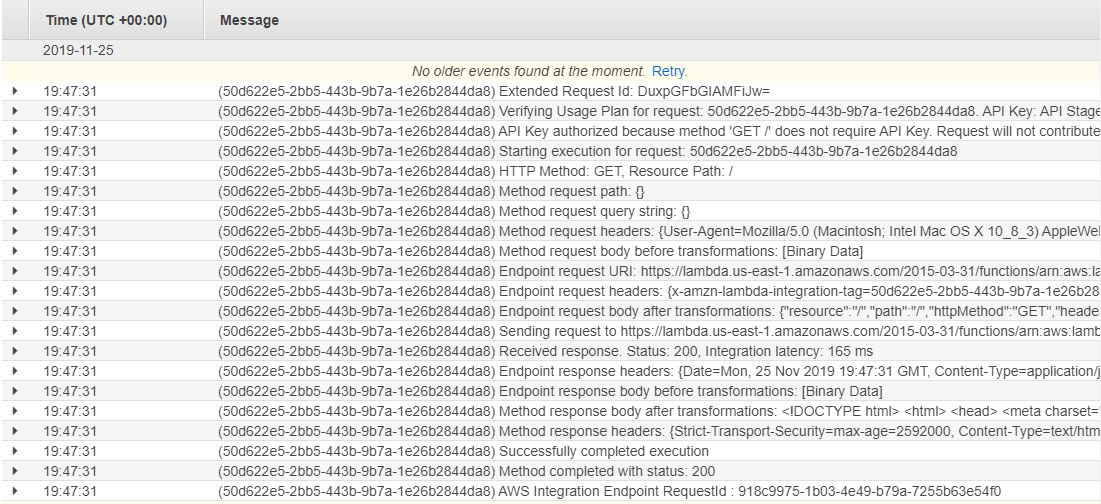
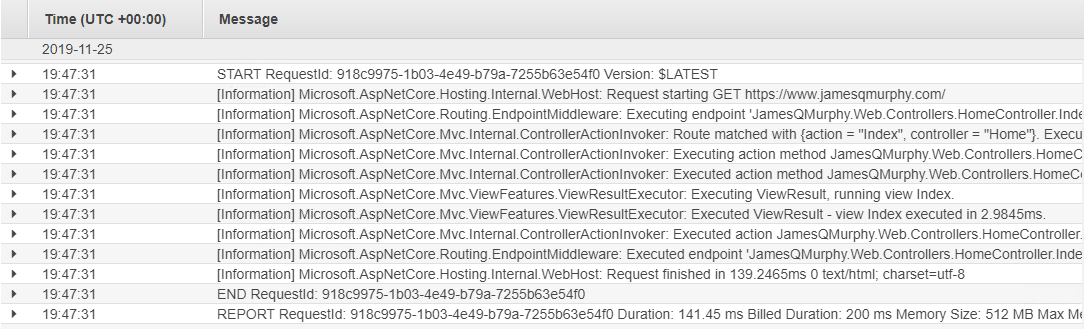
Each log message in the stream has just two parts: the timestamp, and the message itself. As you can see, API Gateway writes the Request ID into each message, and then writes any details on the end. Compare this to a CloudWatch Log Stream from AWS Lambda, which simply writes the console output to the log. (Those familiar with .NET Core will recognize most of the messages as .NET Logging messages. I set the default level to Information.)
Each service can (and does) write to CloudWatch however it chooses. As we will soon see, this poses a challenge when attempting to analyze the logs, even with the built-in tools like CloudWatch Logs Insights.
Trying CloudWatch Logs Insights
I first learned of AWS CloudWatch Logs Insights through, of all things, a banner on the CloudWatch Logs page:
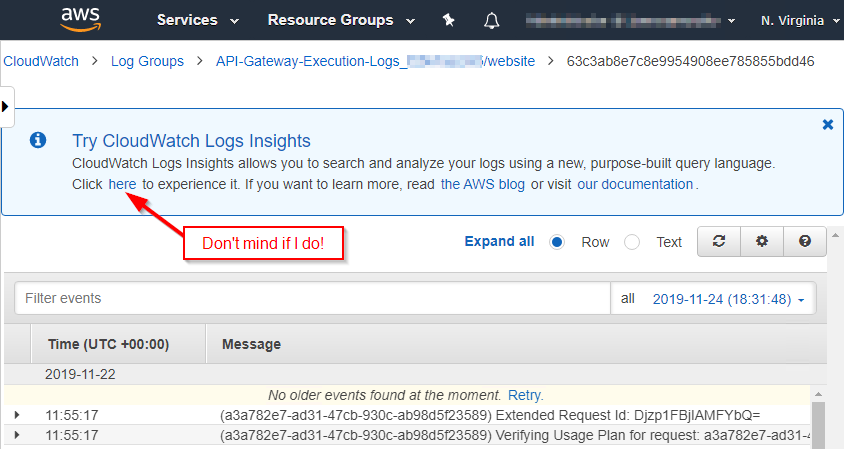
I decided to give CloudWatch Logs Insights a try and see what it could analyze from my website's Log Groups. For starters, I selected the Log Group for the API Gateway service. This is what the default query returned:
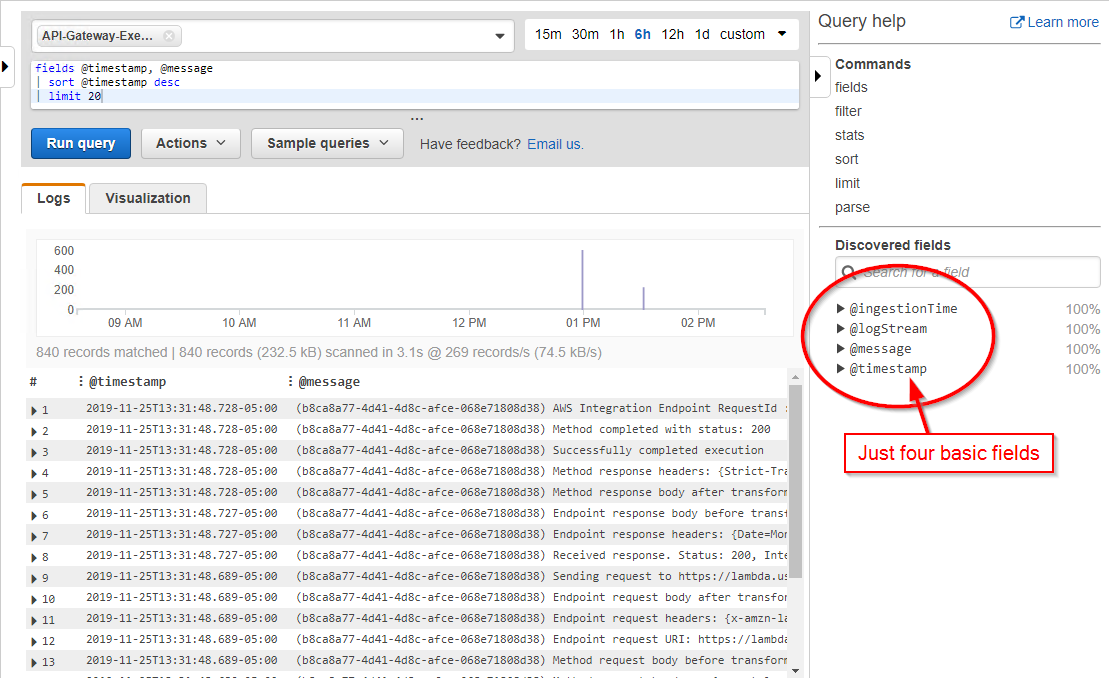
For API Gateway, CloudWatch Logs Insights will only discover the basic built-in fields such as @timestamp and @message. It didn't even discover the Request ID field.
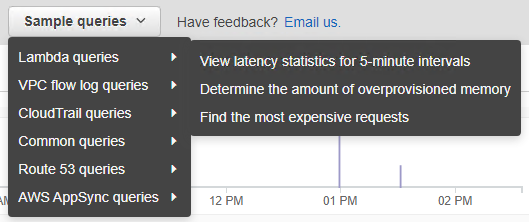
Next, I looked at the sample queries. There was nothing specific to API Gateway, but there were some other AWS services listed:
The sample queries for Lambda functions piqued my interest, so I selected the Log Group for my website's Lambda function and chose the "Find the most expsensive requests" query. The query worked, and furthermore, a few more fields were automatically discovered:
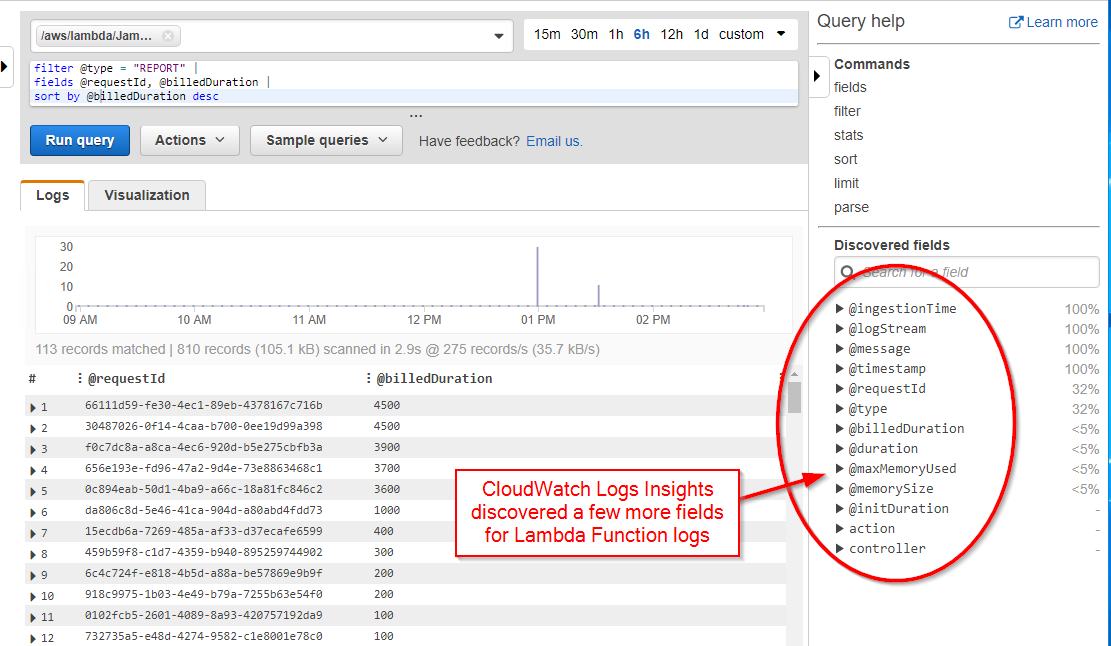
However, even with these additional fields, the query didn't provide much useful information. In the screenshot above, we can see that two requests were billed at 4500 milliseconds, but since we only have the request IDs, we don't know what those requests actually are without further querying.
Turning back to the API Gateway logs, we can see that all of the relevant information is present in the logs. The problem is that the information is smeared across several log messages. What I needed was a way to combine the relevant parts of those messages into a singular, more useful log message.
It turns out, there is a way... and this is where I got to use my PowerShell skills.
Subscribing to CloudWatch Logs
One of the coolest features of Lambda Functions is that they can be triggered in response to just about anything within AWS. In this case, I took advantage of CloudWatch Logs Subscriptions, which can trigger a Lambda function after a Log Stream has been written. And since Lambda Functions can be written in PowerShell, I now had an easy way to run a PowerShell script to process the CloudWatch Logs from API Gateway.
The full source of the resulting PowerShell script can be found [here].
When running as an AWS Lambda Function, PowerShell scripts get two built-in variables: $LambdaInput and $LambdaContext. For CloudWatch triggers, $LambdaInput contains a GZip-compressed, Base 64-encoded stream of the log messages that were written. This is how to decode the data in PowerShell:
$ZipBytes = [System.Convert]::FromBase64String($LambdaInput.awslogs.data)
$ZipStream = New-Object System.IO.Memorystream
$ZipStream.Write($ZipBytes, 0, $ZipBytes.Length)
$ZipStream.Seek(0, [System.IO.SeekOrigin]::Begin) | Out-Null
$GZipStream = New-Object System.IO.Compression.GZipStream($ZipStream, [System.IO.Compression.CompressionMode]([System.IO.Compression.CompressionMode]::Decompress), $true)
$streamReader = New-Object System.IO.StreamReader($GZipStream, [System.Text.Encoding]::UTF8)
$event = $streamReader.ReadToEnd() | ConvertFrom-Json
In the resulting $event object, the log messages themselves are in the logevents property, so it's a simple call to ForEach-Object to iterate through the messages. Using the Request ID GUID as a grouping mechanism, I create a custom object ($requestObj) to hold the details of each HTTP request. After the loop, I wind up with a collection (as a hashtable) of objects, each one representing a single HTTP request:
$regexGuid = '[0-9a-f]{8}[-][0-9a-f]{4}[-][0-9a-f]{4}[-][0-9a-f]{4}[-][0-9a-f]{12}'
$requestObjects = @{}
$event.logEvents | ForEach-Object {

    $thisLogEvent = $_

    # See if message matches patten:  (GUID) logMessage
    if ($thisLogEvent.message -match "^\(($regexGuid)\) (.+)`$") {
        $requestId = $Matches[1]
        $logMessage = $Matches[2]

        if ($requestObjects.ContainsKey($requestId)) {
            $requestObj = $requestObjects[ $requestId ]
        }
        else {
            $requestObj = New-Object -TypeName PSObject -Property @{
                id = $requestId
                timestamp = $thisLogEvent.timestamp
                'aws.loggroup' = $event.logGroup
                'aws.logstream' = $event.logStream
            }
        }

        # Look for log messages with specific patterns (see below)
        switch -Regex ($logMessage) {
            ...
        }

        $requestObjects[ $requestId ] = $requestObj
    }
}
To gather the specific properties of each request, I look for specific log messages using regular expressions. The majority of the properties come from the Method request headers and Method response headers messages. To parse those, I wrote a function named Split-Headers; you can find the source code to this function in the PowerShell script. Note that I use the Successfully completed execution message to calculate the total elapsed time of the request:
        # Look for log messages with specific patterns
        switch -Regex ($logMessage) {

            '^HTTP Method: (\w+), Resource Path: (.+)$' {
                $requestObj |
                    Add-Member -MemberType NoteProperty -Name method       -Value $Matches[1] -PassThru |
                    Add-Member -MemberType NoteProperty -Name resourcepath -Value $Matches[2]
            }

            '^Method request headers: \{(.*)\}$' {
                Split-Headers -headers $Matches[1] -prefix request | ForEach-Object {
                    $requestObj | Add-Member -MemberType NoteProperty -Name $_.name -Value $_.value
                }
            }

            '^Method response headers: \{(.*)\}$' {
                Split-Headers -headers $Matches[1] -prefix response | ForEach-Object {
                    $requestObj | Add-Member -MemberType NoteProperty -Name $_.name -Value $_.value
                }
            }

            '^Method completed with status: (\d+)$' {
                $requestObj |
                    Add-Member -MemberType NoteProperty -Name httpstatus -Value $Matches[1]
            }

            '^Successfully completed execution$' {
                $elapsed = $thisLogEvent.timestamp - $requestObj.timestamp
                $requestObj |
                    Add-Member -MemberType NoteProperty -Name elapsed -Value $elapsed
            }
        }
Once I have the request objects, it's simply a matter of writing them out in JSON format to a new CloudWatch stream, since AWS CloudWatch Logs Insights will automatically discover fields in JSON-formatted data. For simplicity, I simply wrote the contents to the console, knowing that they would be captured in the AWS CloudWatch Logs:
# Write out each request object
$requestObjects.Values.GetEnumerator() | ForEach-Object {
    Write-Host ($_ | ConvertTo-Json -Compress)
}
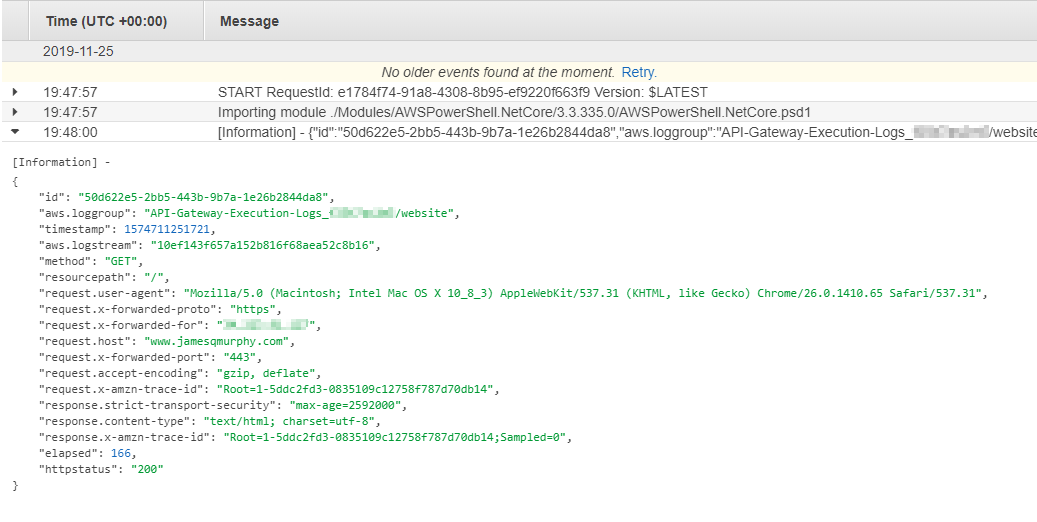
Below are the results. The "[Information]" text comes from the PowerShell host that AWS uses (which I'll explore in another post). Since it sits outside of the JSON formatting, it doesn't get in the way.
In fact, expanding the record right within the AWS Console will format the JSON nicely:
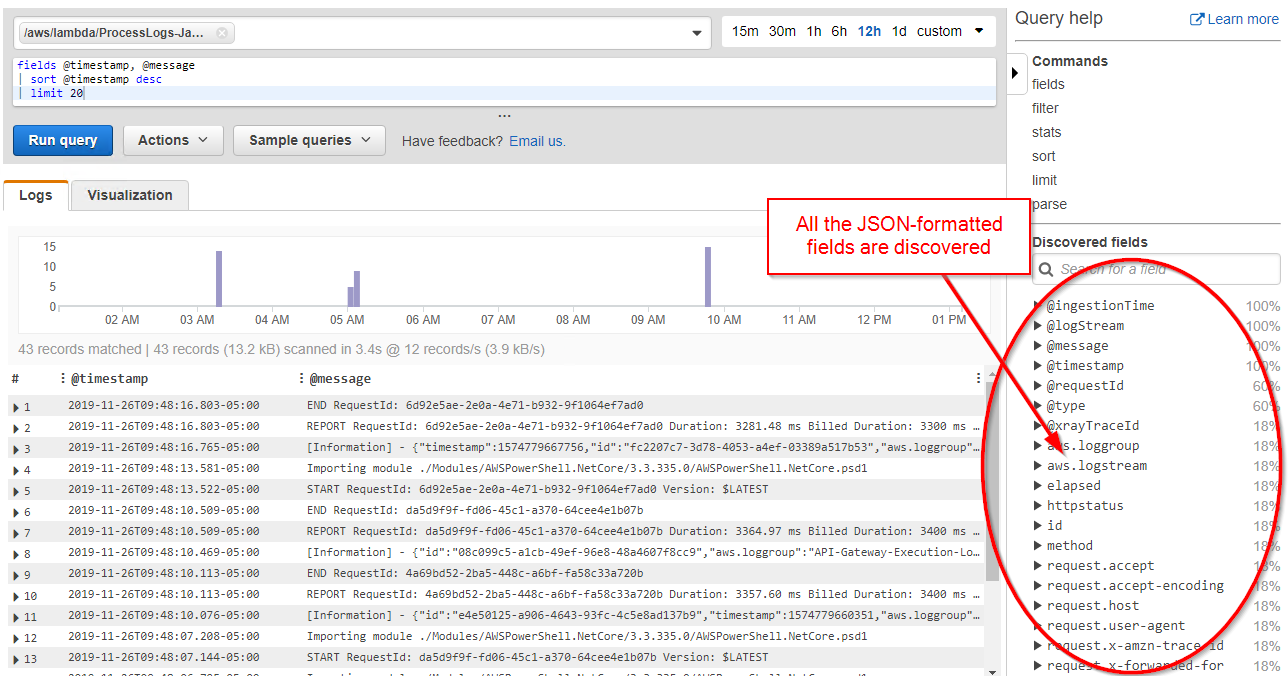
If I use CloudWatch Logs Insights on the PowerShell scrpts Log Group, it discovers all of the JSON fields:
And now we can set up some more useful queries. Here are a couple that I popped into a dashboard. Of course, I don't have any real traffic yet, but I'm prepared for when it happens!
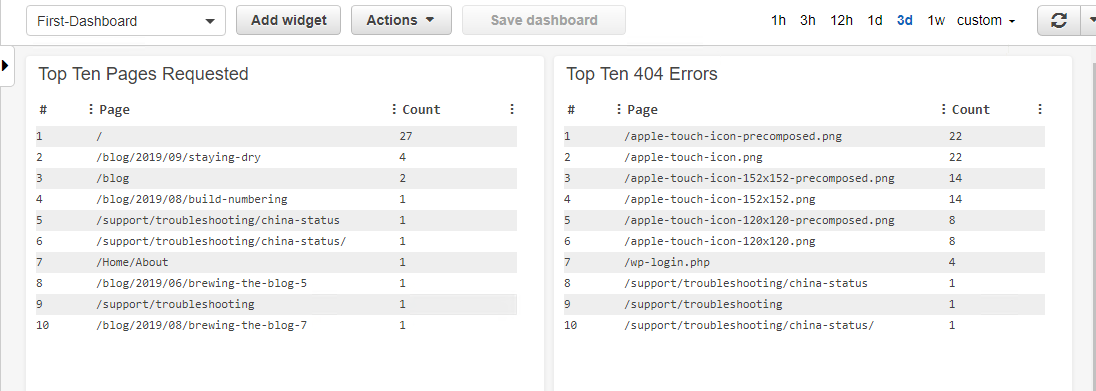
The actual queries used in the dashboard are:
Top Ten Pages Requested
filter resourcepath like /^/[^\.]*$/
| stats count(*) as Count by resourcepath as Page
| sort Count desc
| limit 10
Top Ten 404 Errors
filter httpstatus = '404'
| stats count(*) as Count by resourcepath as Page
| sort Count desc
| limit 10
Hey, What Are Those?
Even for a site that gets almost no traffic, I learned something from analyzing the logs. The list of 404 errors is especially telling. Initially, I had no idea what was causing the apple-touch-icon-XXX.png requests. After a couple of quick searches, I had my answer, but the point is that I would have never have known about them without the logging analysis. (And I'll explain them in an upcoming post!)
A Disadvantage To This Approach
Setting up this logging mechanism was quick and easy, especially since I could leverage my PowerShell knowledge and I didn't have to worry about creating my own CloudWatch Log Stream. But one slight disadvantage to this approach is that the timestamps used by CloudWatch Logs Insights are the timestamps of the script, not the timestamps of the original events! They are close; in the example above, the timestamp of the processed log message was only 29 seconds behind the timestamp of the original log message. But they are different, which may or may not be significant in your use case.
The proper fix for this, of course, is to simply write the JSON message to a separately-created Log Stream using the CloudWatch Logs API, where you can pass the actual timestamp value as a parameter. This approach requires some coding, and it also requires that the Lambda function has permission to create a Log Stream.
One other point is that the logs here come exclusively from API Gateway. CloudWatch Logs Insights does not allow for any "join" operations between different Log Groups, so if you include the logs from another source (e.g., Lambda), they would not be related in any way.
Summary
Although I should still learn Python, AWS Lambda's support of PowerShell means that my years of PowerShell experience can be put to use to write rich Lambda functions. Using this knowledge, plus the built-in CloudWatch Logs Insights tooling, I was able to quickly spin up a couple of dashboards that provided me some real data -- and some new items to work on!
-
One of the best parts of attending Microsoft Ignite, at least for an extrovert like me, is the random conversations you have with people from all parts of the industry. This story is a prime example of learning something awesome at a conference, not from a conference.↩
-
For now, at least. Python is extremely popular these days and as a result, it's showing up everywhere. The writing is on the wall... I need to learn it.↩